
Progressive Failure Analysis
How a laminate keeps carrying load after its first ply fails, and how to read First Ply Failure through Last Ply Failure.
First Ply Failure vs Last Ply Failure
A single failure criterion check tells you when the weakest ply in the laminate fails, but composite laminates rarely lose all load-carrying capability at that point. Progressive failure analysis walks the laminate past that first failure to find out how much more load it can actually take.
- First Ply Failure (FPF): the load multiplier at which the first ply anywhere in the laminate reaches the chosen failure criterion. The conservative, "weakest link" design threshold used by most certification standards.
- First Matrix Failure (FMF): the load multiplier at the first matrix or shear failure. This is the onset of transverse cracking, which is damage rather than collapse: the fibers are intact and the laminate keeps carrying. On a pressure vessel it is the leak load rather than the burst load.
- First Fiber Failure (FFF): the load multiplier at the first fiber-direction failure. The primary load path starts breaking here, so this is the onset of structural failure rather than damage.
- Last Ply Failure (LPF): the largest load multiplier the laminate carries at any point in its damage sequence. This is ultimate failure, after load has been redistributed through every ply failure in between.
LPF is the peak of the sequence, not simply its last event, and the distinction matters. A damaged laminate is sometimes stronger than the state before it: shedding a cracked ply's transverse stiffness can relieve the coupling that was driving the stress, so the reserve factor can rise from one event to the next. Taking the peak reports the largest load the laminate genuinely survives; taking the final event could report a load it only reaches after passing through a weaker state it would never have got past.
For a criterion that cannot identify a failure mode (Tsai-Hill, Tsai-Wu, described below) FMF and FFF are not reported at all, rather than being shown as a guess.
The FPF/LPF ratio varies widely by layup, loading type, and the chosen failure criterion, and there is no single "typical" range that holds across laminates. The gap between the two is reserve strength: progressive failure analysis finds it, a single FPF check never sees it.
The load-step / degrade / rebuild loop
Starting from the undamaged laminate, the analysis repeats a four-step loop:
- Compute every ply's stress at all three through-thickness positions (bottom, mid, top) against the reference load.
- Find the exact load multiplier λ at which the next ply reaches the chosen failure criterion, which is the minimum safety factor across all surviving plies and positions.
- Degrade that ply's stiffness according to its failure mode, then rebuild the ABD matrix.
- Repeat, re-solving from scratch against the same fixed reference load, until the sequence reaches its end.
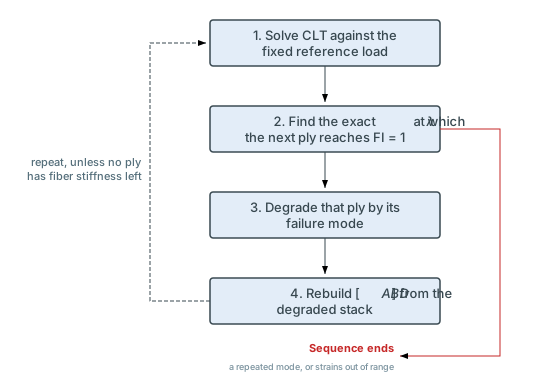
Every pass starts over from the same reference load, against a stack that is one ply softer than it was. The exit conditions are the three listed below.
Three things end the sequence, and the tool reports which one it was:
- No fiber-direction stiffness left anywhere. Every ply has lost its fibers, so the laminate has no primary load path remaining.
- A ply fails again in a mode it has already lost. A ply whose transverse stiffness is already at a millionth of pristine cannot crack its matrix a second time. If the criterion still reports one, the load path being described no longer exists in the model, and continuing would invent failures that never happened.
- Strains leave the small-displacement range. Classical Lamination Theory assumes small displacements. Once enough plies are degraded, the surviving stiffness can be so small that the mathematically correct solution is a curvature no real laminate could reach. That is a limit of the theory rather than of the arithmetic, so it is checked by magnitude.
In the second and third cases the events already reported still stand, and their peak is still the LPF load. What stops is the invention of further ones.
Because every criterion returns an exact safety factor (the multiplier from the current stress state to a failure index of 1.0), and the CLT solve is linear in applied load, each λ is found directly, with no incremental load stepping or bisection needed. Each event's λ is an absolute multiplier on the original reference load, not a step added to the previous one.
All three through-thickness positions are checked at every step, not just the midplane. Degrading a ply breaks a symmetric laminate's symmetry, so the B matrix becomes non-zero and the laminate develops curvature under pure membrane load from that event onward. A midplane-only check would then pick the wrong ply, at the wrong λ, for the rest of the sequence.
Stiffness degradation rules
When a ply fails, its stiffness contribution is reduced rather than removed outright: the degraded properties are re-inserted into the ABD rebuild multiplied by a residual stiffness factor of 10-6 rather than being set to exactly zero. The reason is numerical: the transverse Poisson's ratio is derived as v21 = v12·E2/E1, so a fiber failure that set E1 to exactly zero would divide by zero and flood the rebuilt ABD matrix with NaN. A residual factor of 10-6 keeps that division well-defined while leaving the degraded ply's practical contribution to laminate stiffness negligible, small enough to be a rounding error but never small enough to break the matrix inversion. The specific properties reduced depend on the failure mode:
- Fiber failure: E1 is reduced to a residual value. The ply can no longer carry load in the fiber direction. Usually the most consequential mode, since fiber failure often triggers rapid subsequent failures in neighboring plies.
- Matrix failure (transverse cracking): E2 and G12 are reduced to a residual value; E1 is untouched. The ply still carries axial load but not transverse or shear load. This is the most common first failure event in many laminates.
- Complete degradation: all stiffnesses reduced to a residual value, when a ply has suffered both fiber and matrix failure.
This is an instantaneous (sudden) degradation model: the moment a ply reaches FI = 1.0, its stiffness drops straight to the residual value at that same load step, with no intermediate damage state. Some progressive failure formulations use gradual degradation instead, ramping a damage variable up continuously with load past first failure rather than jumping straight to fully degraded. That is closer to how damage such as matrix microcracking really accumulates. It costs you a damage evolution law per mode, and the exact-lambda stepping this tool relies on, because stiffness is then no longer constant between failure events. Instantaneous degradation is simpler, it is the worked example used by the underlying methodology, and it tends to be conservative, since it removes a ply's stiffness contribution sooner than a gradual model would. Which model a tool uses is one reason FPF/LPF ratios differ between progressive failure tools that agree on the failure criterion.
Every criterion except Tsai-Hill and Tsai-Wu identifies a physically distinct failure mode directly, so the degradation applied follows immediately from the criterion result. Those two produce a single interactive failure index without inherent mode identification. Acting on a guessed mode would mean choosing a partial degradation (knocking down transverse stiffness but not fiber stiffness, or the reverse) on the strength of an inference the criterion never made. So for those two, every event is treated as general material failure and all three stiffnesses are degraded together. The criterion said the ply failed; it did not say how. See Failure Criteria for how each criterion evaluates a ply.
Reading the failure-event sequence
The dashboard reports the full chronological sequence of failure events, each with:
- λ: the absolute load multiplier on your reference load at which this event occurs.
- Ply and through-thickness position: which ply failed, and at which of its three z-positions.
- Mode and degradation applied: fiber, matrix, or complete, and what stiffness reduction was applied.
The first event's λ is the FPF load, and the peak λ across the sequence is the LPF load. The first event whose mode is matrix or shear gives FMF, and the first fiber-mode event gives FFF. The dashboard also shows each ply's damage state at your applied load (λ = 1.0) alongside the full failure sequence, so you can see both "is my laminate safe under the load I entered" and "how much margin do I actually have."
The sequence in full-sequence scope, so every event up to LPF is listed rather than only those reached at λ = 1.0. The first row is FPF; the highest λ is LPF.
The load-strain curve
The event table lists what happened. The load-strain curve shows what it did to the laminate. Plot the load multiplier against the resulting midplane strain and you get a curve made of straight segments joined at kinks, which is the clearest single picture of progressive failure there is.
It comes out that way for a specific reason. Between two failure events nothing about the laminate changes, and CLT is linear, so strain grows in exact proportion to load: a straight segment. At each event a ply is degraded and the ABD matrix is rebuilt softer than before, so the next segment has a shallower slope. Each segment's slope is the laminate stiffness in force at that stage of damage.
Reading it:
- The first kink is first ply failure. Everything to its left is the undamaged laminate. Everything to its right is load the laminate carries in a damaged state.
- The end of the curve is last ply failure. The horizontal distance between the first kink and the end is the reserve that a design stopping at FPF leaves on the table.
- A small drop in slope is a matrix crack. Matrix failure removes transverse and shear stiffness but leaves the fibers carrying load, so the laminate softens without losing much strength. Several small kinks in a row are the usual signature of transverse cracking working through the off-axis plies.
- A large drop in slope is fiber failure. Losing E1 in a ply removes its main load path, and the plies that pick up that load are then much closer to their own limits. A steep drop is normally followed quickly by the end of the curve.
- A near-vertical drop means collapse. When one failure immediately pushes the next ply past its limit, and that one the next, the events cascade at almost the same load. Practically speaking there is no reserve past that point, whatever the LPF number says.
A long, gently kinked curve therefore describes a laminate that fails gracefully and gives warning. A curve that runs straight to a cliff describes one where FPF and LPF are nearly the same load, and where designing to FPF costs you almost nothing.
In the ABD Composites dashboard
The Progressive Failure tool takes the same reference force/moment resultants as the other analysis tools, plus a Failure Criterion selector covering all nine criteria (Max Stress, Max Strain, Tsai-Hill, Tsai-Wu, Hashin, Puck, Cuntze, Sun and Edge). Run it and you get the FPF and LPF load multipliers up top, then the full chronological event table described above, one row per ply failure, in the order they happen as load increases past your reference load.
Because the run is exact-lambda stepping rather than fixed increments, the analysis is instant even for laminates with many plies, and there is no "resolution" setting to tune. Switching the Failure Criterion selector and re-running lets you see how sensitive the FPF/LPF ratio is to the criterion choice for your specific layup.
Author: Rick Schrijver
References
- Sleight, D.W. Progressive Failure Analysis Methodology for Laminated Composite Structures. NASA/TP-1999-209107, NASA Langley Research Center, 1999, ntrs.nasa.gov.
- Chang, F.-K. & Chang, K.-Y. "A Progressive Damage Model for Laminated Composites Containing Stress Concentrations." Journal of Composite Materials, Vol. 21, No. 9, 1987. doi:10.1177/002199838702100904
- Talreja, R. & Singh, C.V. Damage and Failure of Composite Materials. Cambridge University Press, 2012. doi:10.1017/CBO9781139016063
- Daniel, I.M. & Ishai, O. Engineering Mechanics of Composite Materials, 2nd Ed., Oxford University Press, 2006.
Frequently Asked Questions
Run progressive failure on your laminate
The dashboard's Progressive Failure tool walks your laminate from first ply failure to last ply failure and reports the full failure-event sequence. Create a free account to get started.
Create free account