
Ply Stresses & Strains Through the Thickness
How CLT recovers stress and strain at the top, middle, and bottom of every ply, and why a single midplane value is not enough.
Why stress varies through the thickness
The ABD matrix gives you the laminate's midplane strains ε0 and curvatures κ, six numbers that describe the whole laminate. But no physical point in the laminate actually sits at the midplane except the midplane itself. To know whether a specific ply survives, you need the strain (and stress) at that ply's own position.
The Kirchhoff assumption1 that underlies CLT says lines normal to the midplane stay straight and normal after deformation. One direct consequence: strain varies linearly through the thickness, measured from the midplane by the distance z:
Whenever the laminate has curvature, a ply's top surface sees a different strain than its bottom surface. The curvature can come from an applied bending moment, or from B-matrix coupling in an unsymmetric layup under nothing but in-plane load. Either way, reporting only the midplane value silently discards that gradient.
From laminate strain to ply stress
At each of the three positions (bottom, mid, top), the same four steps recover stress and strain for a given ply:
The thermal and moisture terms are subtracted before computing stress because a ply that is free to expand carries no stress from a uniform temperature or moisture change. Only the mechanical portion of strain, after the free expansion is removed, produces stress. See CLT Theory for the ABD derivation these strains come from.
Top, Mid, Bot
Each ply is evaluated at three z-positions:
- Bottom: the ply's boundary closer to the laminate's bottom surface (z = zk).
- Midplane: the center of the ply, and exactly the average of top and bottom. Because Q̄ is constant within a ply and strain is affine in z, midplane carries no information the other two do not. It is reported anyway, because it is the conventional single value engineers expect.
- Top: the ply's boundary closer to the laminate's top surface (z = zk+1).
Top and bottom coincide with the midplane value only when the laminate has zero curvature at that ply, which holds for a purely symmetric laminate under pure membrane load with no thermal/moisture gradient, but not in general. Once curvature is present, checking only the midplane can miss the ply surface that actually fails first.
Global vs Local coordinates
Results can be viewed in either coordinate frame:
- Global (x-y): one fixed frame for the whole laminate, independent of ply angle. This is the frame in which the plies can be compared directly against each other, because they all share it. Strain is continuous across a ply boundary in this frame, since bonded plies cannot slide relative to one another; stress is not, because two plies held at the same strain carry different stress when their stiffnesses differ.
- Local (1-2): each ply's own fiber-aligned frame (1 = fiber direction, 2 = transverse). This is the frame every failure criterion uses, since strength allowables (S1t, S2c, S12, etc.) are measured in material coordinates.
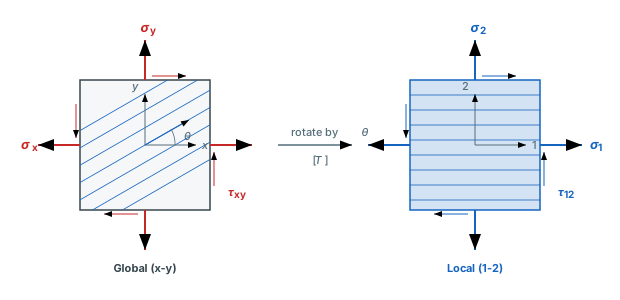
One point, one stress state, two frames. Switching the toggle does not re-run the analysis or change the load; it rotates the components through the ply angle θ.
In the ABD Composites dashboard
The Ply Stresses & Strains tool lists every ply as three rows (Top, Mid, Bot), each showing three components: either stress or strain, toggled by the Stress/Strain switch. The Global/Local toggle switches the whole table between laminate (x-y) and material (1-2) coordinates without re-running the analysis, since both are recovered from the same ε(z) = ε0 + zκ result.
Because the Mid row is exactly the average of Top and Bot, comparing a ply's three rows tells you whether curvature matters at that ply. Top and Bot close to Mid means the ply sees essentially uniform strain through its thickness. Rows that diverge noticeably mean curvature, whether from an applied moment or from B-matrix coupling, is doing real work there.
The through-thickness plot
The same numbers plotted against z make the pattern far easier to see than a table does. The chart puts the response on the horizontal axis and the through-thickness position on the vertical one, so the laminate is drawn the way you would look at its cross-section.
Two features of the plot carry the whole of CLT between them:
- Straight within each ply. Strain is linear in z and Q̄ is constant inside a ply, so every ply contributes a straight segment. A vertical segment means that ply sees no gradient; a sloped one means curvature is present.
- Jumps at the ply interfaces, in stress but not in strain. Switch the chart to strain and the line is continuous through the whole laminate, because the plies are bonded and cannot slide. Switch back to stress and it steps at every interface, because two plies at the same strain but different orientation have different stiffness. Those steps are not a numerical artefact; they are the reason a laminate works at all, since the stiff plies pick up load the compliant ones shed.
Switching to local coordinates rotates each ply's values into its own fiber frame, so the plot then shows what each ply itself experiences rather than how the plies compare. That is the view to use when you are asking which ply is closest to failing.
Why this feeds failure analysis
Ply stress recovery is the bridge between the laminate-level ABD solve and ply-level failure evaluation. Every failure criterion, and the progressive failure analysis built on top of it, is applied to the local-coordinate stress computed at all three z-positions, not just the midplane. A ply's top and bottom surfaces are checked independently because whichever one is closer to failure determines when that ply actually fails.
Author: Rick Schrijver
References
- Jones, R.M. Mechanics of Composite Materials, 2nd ed., Taylor & Francis, 1999.
- Kirchhoff, G.R. "Uber das Gleichgewicht und die Bewegung einer elastischen Scheibe," Journal fur die reine und angewandte Mathematik, vol. 40, pp. 51-88, 1850. doi:10.1515/crll.1850.40.51
Frequently Asked Questions
See ply-by-ply results on your laminate
The dashboard's Ply Stresses & Strains tool reports every ply's stress and strain at bottom, mid, and top, in either coordinate frame. Create a free account to get started.
Create free account